


Today's topic, I am learning how to establish connection between Power BI & MS SQL Server to get the data into Power BI and work with the data.
I. Data Loading & simple queries in SQL Server
Head to this link to download the backup file of the database. [Link]
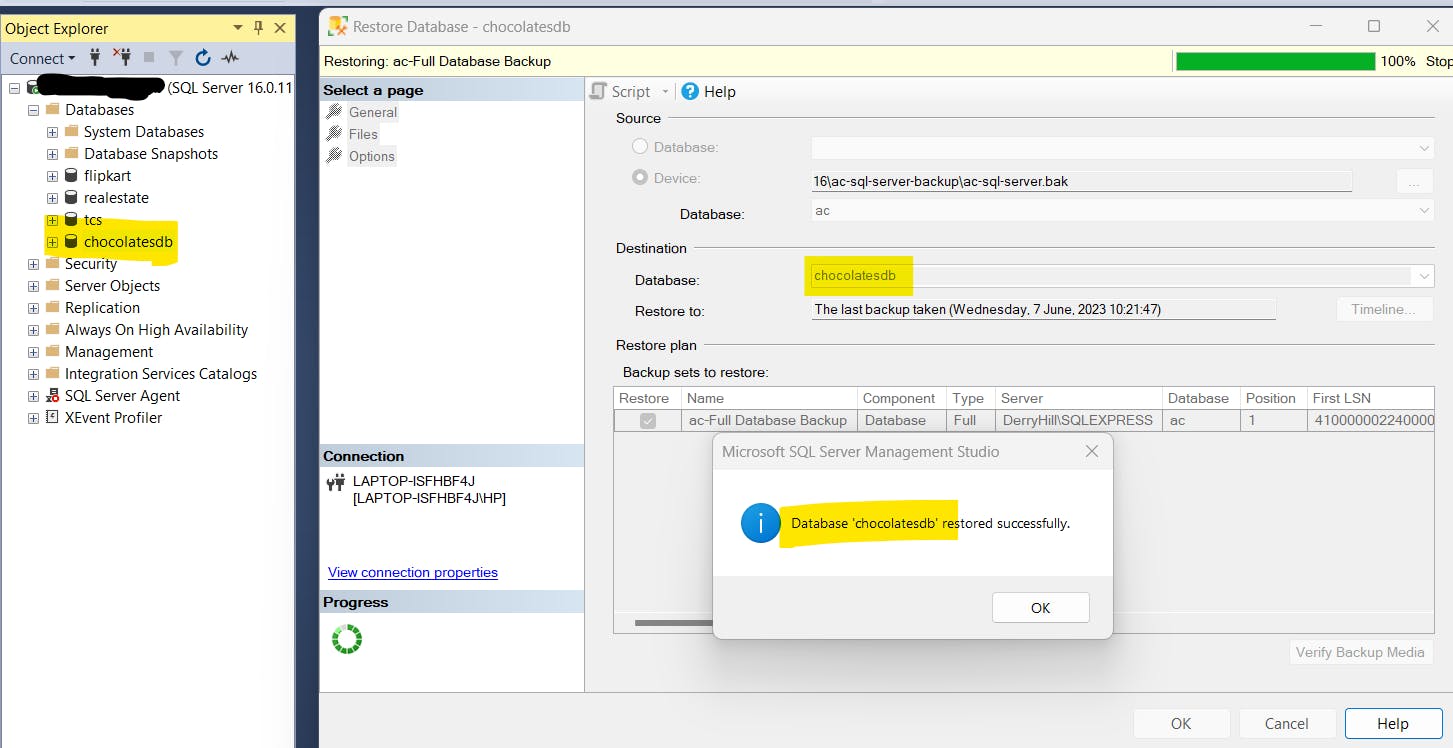
Restore in the MS SQL Server and perform the sample queries to get familiar with the data.
Restore database / device
verify backup media
relocate files
Image showing successful restoration:
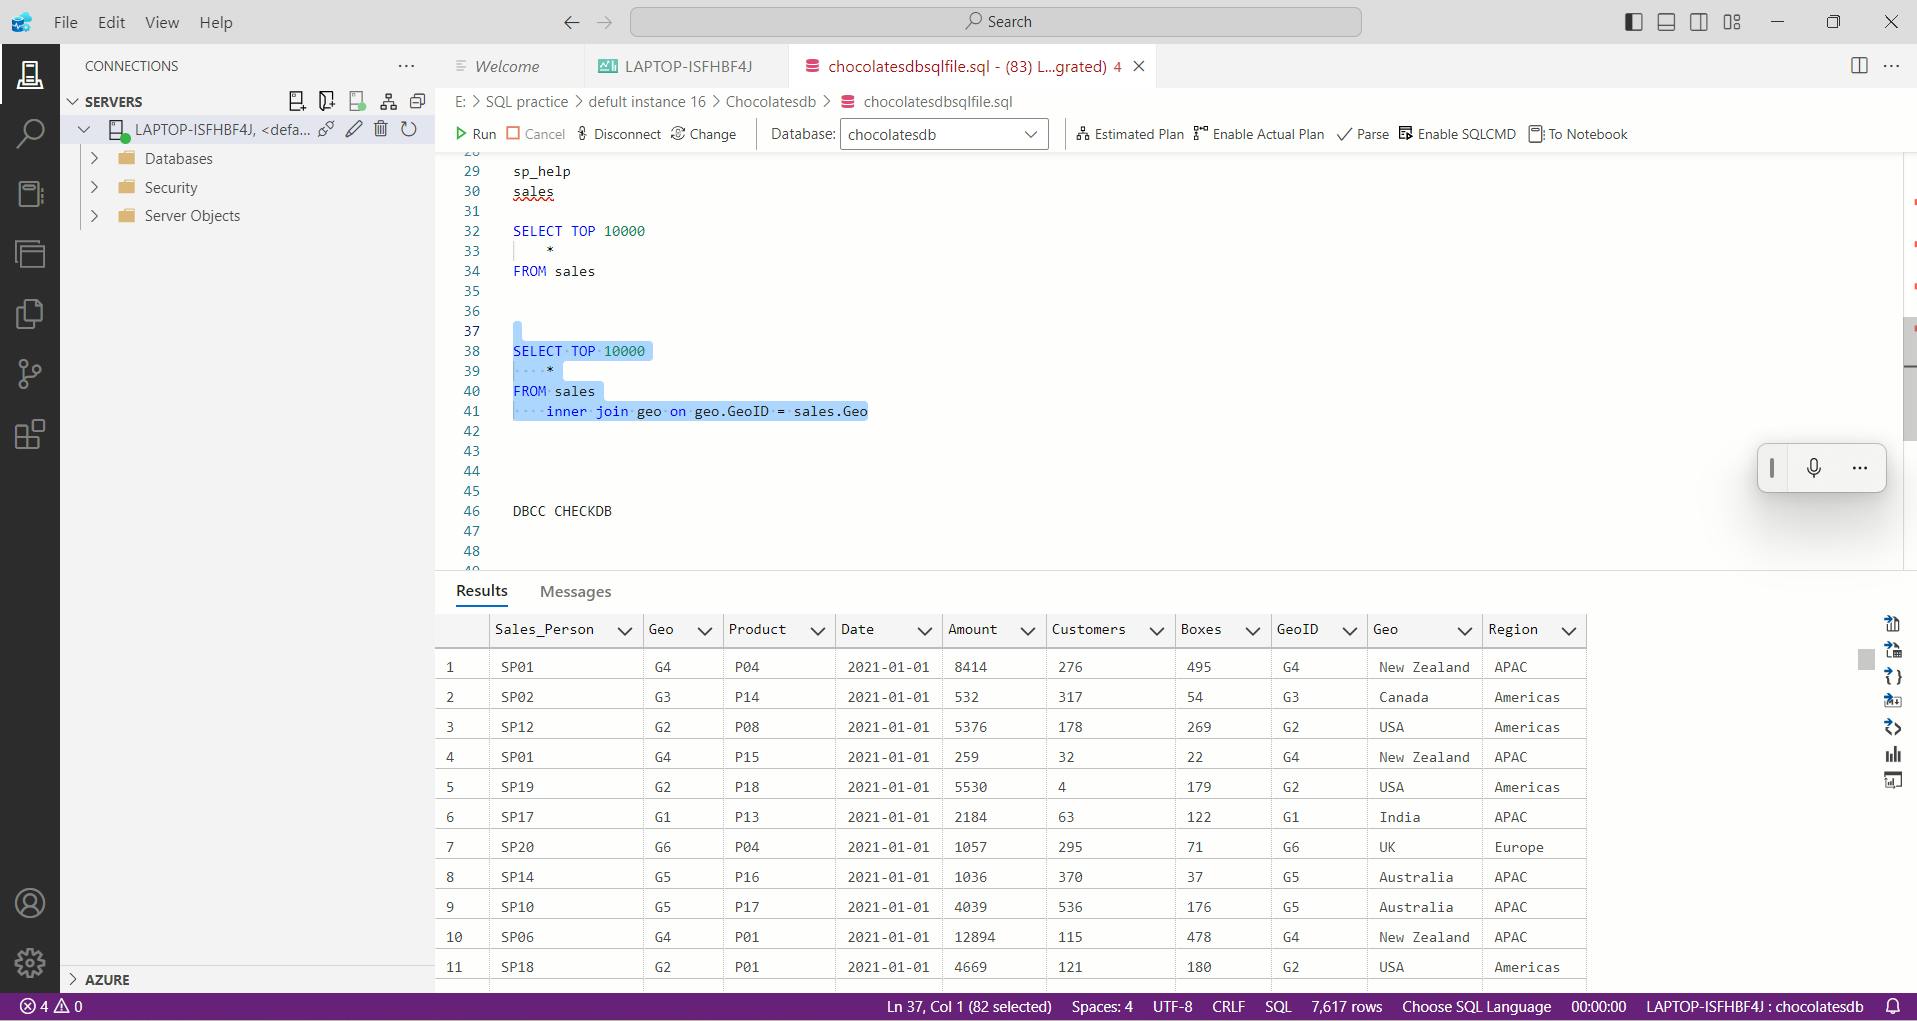
Query results:
II. Create sales Report in Power BI
a. Establishing connection between Power BI and SQL
You will be asked for login credentials When connecting first time to a server after that the credentials will be stored to prevent reentering.
To clear the login credentials in Power BI:
File/Options and settings/Data source settings/search for the server name/ Clear Permissions.
Now,
Select Get Data/more/SQL Server/provide the server with IP.
localhost:portnumber
To identify the port number run the below query in Azure Data Studio / SSMS:
USE MASTER
GO
xp_readerrorlog 0, 1, N'Server is listening on'
GO
Data connectivity mode:
Import: Will store the data in power BI, Use this when less data in SQL server.
Direct Query: Will make call to SQL server every time, use this when dealing with large data.
select windows auth
select the tables/load
Faced an error:
Feedback Type: Frown (Error)
Error Message: We couldn't connect to your DirectQuery data source or internal model. Double-check that your server and database names are correct, and that you have permission to access them.
Successfully connected second time when used import Data connectivity mode.
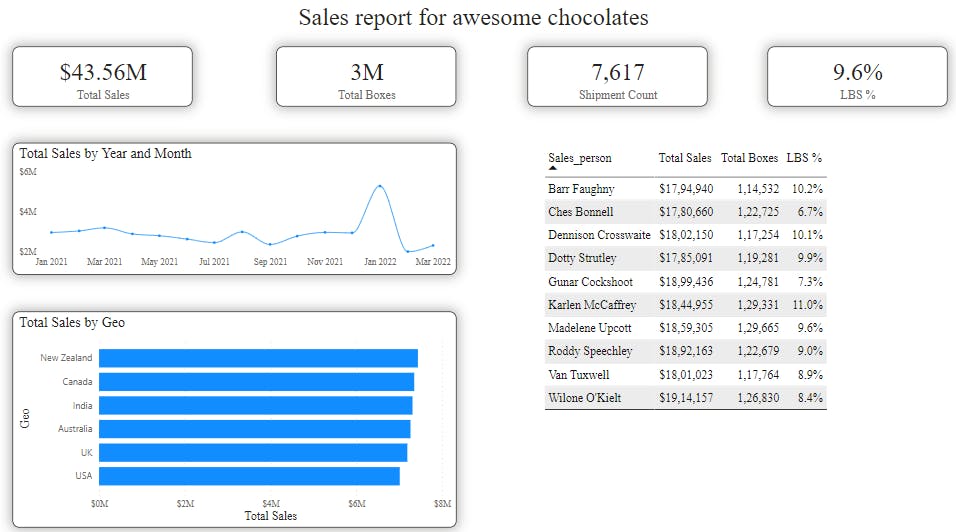
b. Report in Power BI
Measure in Sales tables:
Sum of total sales measure:
Total Sales = SUM(sales[Amount])
Sum of total box's amount measure:
Total Boxes = SUM(sales[Boxes])
Number of shipments measure:
Shipment Count = COUNTROWS(sales)
Low Box shipment measure:
Low Box Shipments = CALCULATE([Shipment Count], sales[Boxes] < 50)
LBS % measure:
LBS % = DIVIDE([Low Box Shipments],[Shipment Count])
Now,
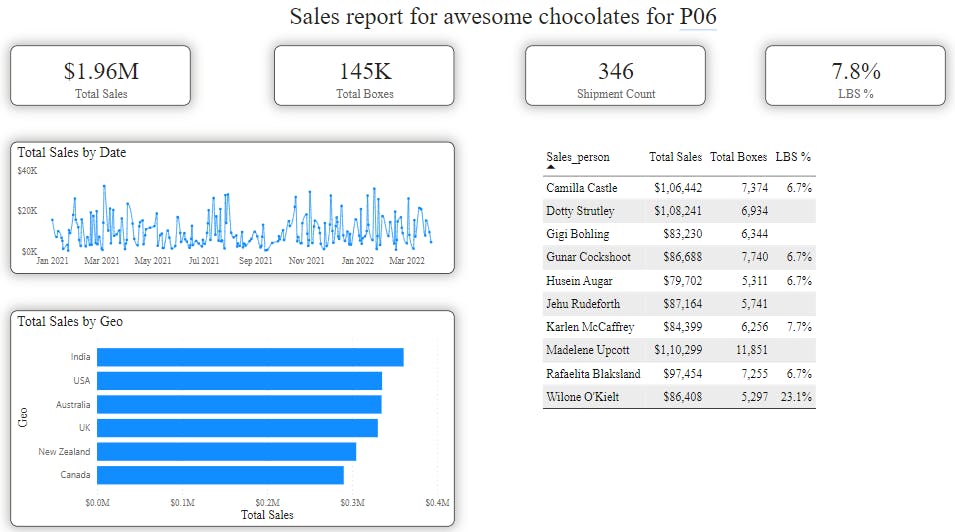
III. Dynamic queries with Power Query parameters
Parameterize the queries & set a variable with power BI so that changing the values the whole reports gets updated.
Power BI/ Home/get data/ provide credentials along with database/ select advanced/ SQL statement / write the SQL query / ok
SELECT TOP 10000
    *
FROM products
WHERE product_id  ='P06'
Power Query / Home/ query 1/ right click / edit query/
= Sql.Database("localhost:1433", "chocolatesdb", [Query="SELECT TOP 10000#(lf) *#(lf)FROM sales#(lf)WHERE product ='"& #"Product code"&"'"])
click edit permission / run.
Go to sales table / applied steps / delete navigation/ choose source / paste the formula.
Creating a measure for the parameter at measure level:
Selected product = SELECTEDVALUE(sales[Product])
Finally,
Conclusion
Learning Objectives,
Data Loading & simple queries
Create sales report:
Measures:
Total sales
Total boxes
Shipment count
Low Box percentage
Visuals
Execute summary
sales by product
Top sales-persons
sales trend
Make dynamic queries with Power Query parameters.